R Statistics

This was an academic work in which I analysed 3 datasets and answered question about the datasets.
Dataset 1: Marine microbial diversity The dataset contained the microbial diversity of marine microbial organism that was sampled at 2 different seasons, at 2 different latitudes. With dataset 1 the relationship if any was explored between the microbial diversity and latitude, time of year (season)
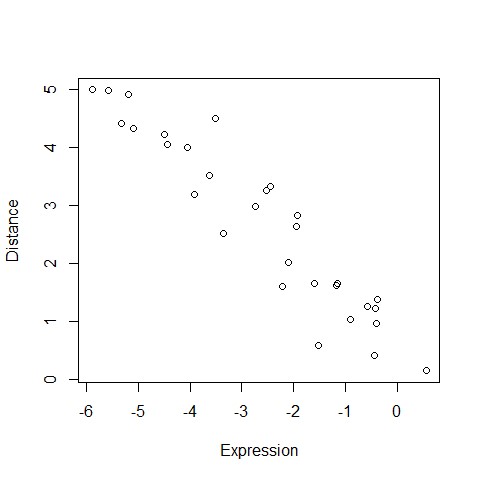
Dataset 2: Pairwise nucleotide substitutions and RNA expression levels The dataset contained luciferase (P08659) and 30 homologous genes expression fold and their pairwise genetic distance from the genes sequence via a phylogenetic tree. For dataset 2 the relationship between expression and genetic distance was explored (and possible reasons for this) along with some model validation.
Dataset 3: HIV viral load and within-patient population dynamics The Dataset contain information about HIV load retrieved from patient sampled in a study. The sample taken from the spinal cord or brain with viral population size, pairwise genetic distance, Shannon population diversity and the CD4+ cell count.
For dataset 3 there was model selection to select the model which was most informative and then analysis of the selected model.
Environment and techniques used
- R
- ANOVA (Analysis of Variance)
- Scatter plot
- Interaction plot
Result
Some visualisation from the analysis
